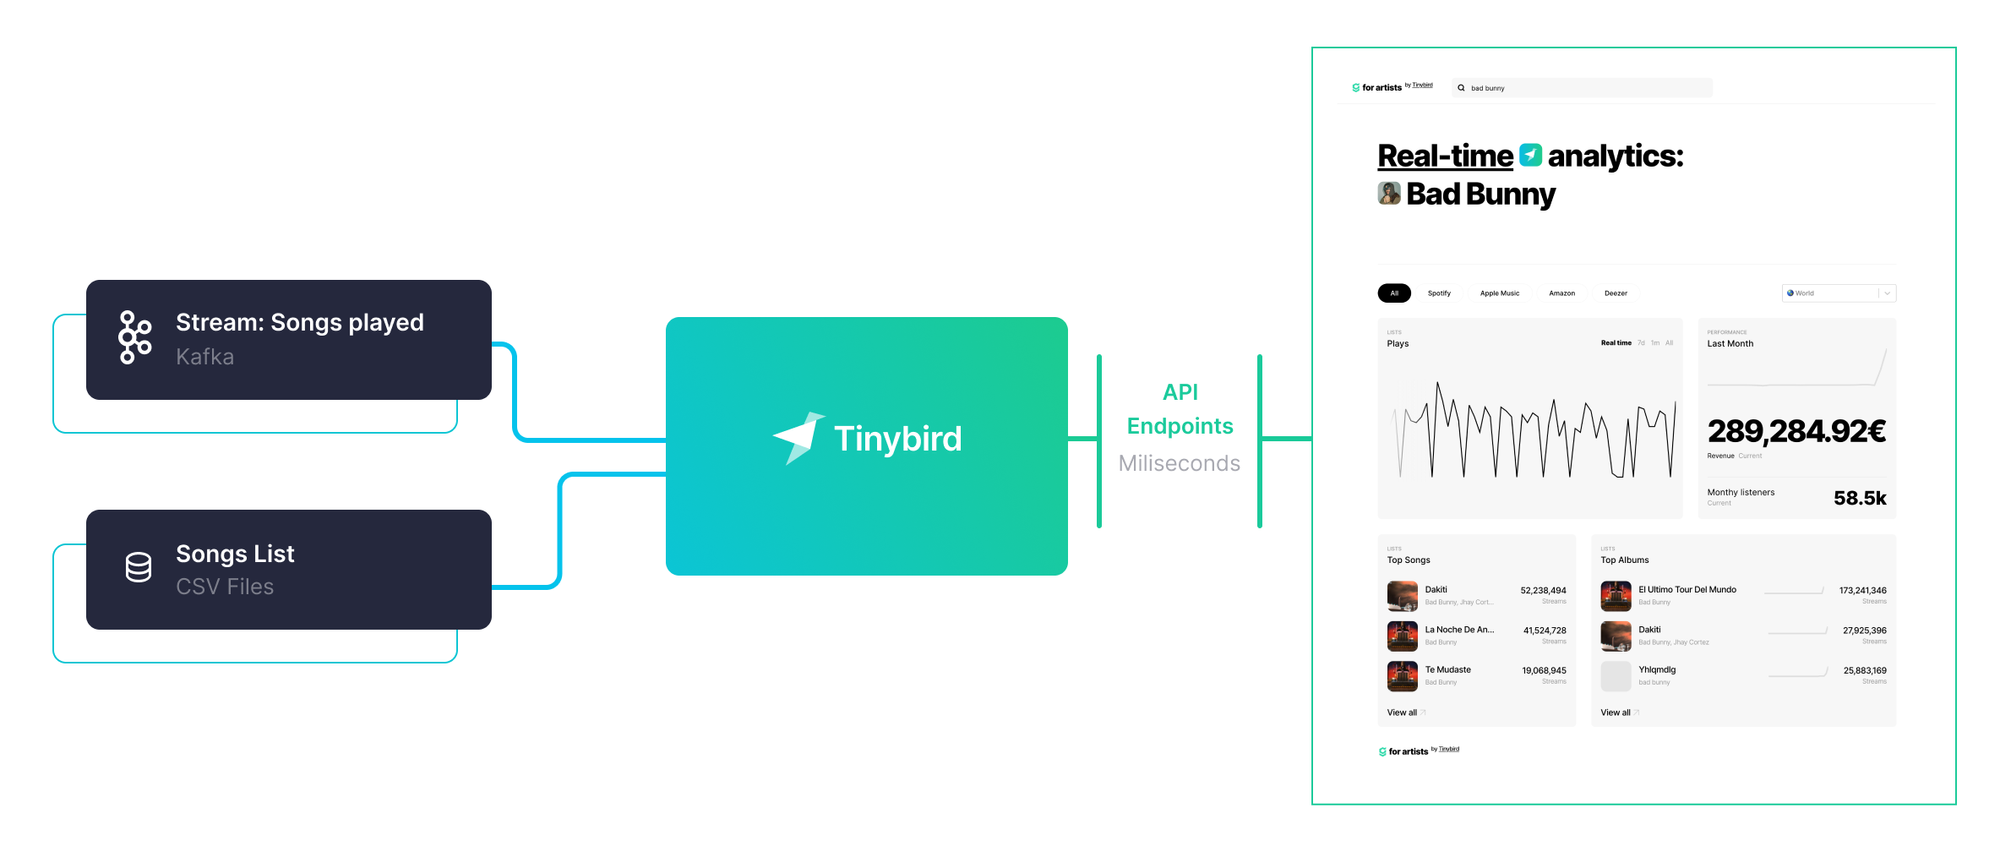
If we have learnt something at Tinybird is this: moving from batch to real-time data analysis changes the way companies operate.
And it has the potential to change entire industries, too.
Take the music industry, for instance, and the situation today. It can take months for artists to learn how much their music has been listened to on a streaming platform: and it’s their livelihood! Every time one of their songs is played they are entitled to receive royalties, but they don’t know how much that will be until months later.
Or take record labels. If they could know in real-time how much each new album is being listened to (or not), they would be able to react much faster. What marketing actions could they take if things are not working well? Or how quickly could they move to secure new artists if they could see the trends in real-time?
Together with our friends and data experts at Galeo, we asked ourselves this question:
How would business be different for music artists, record labels and streaming platforms if all of them could know in real-time how each song is doing?
To try to answer this question, we recently put together a demo and live session that showcased exactly that, running of-course on simulated data. Here is a live recording of the session (in Spanish) where you can see how we built a real-time data product that analyses tens of billions of music streams.
In this post, we walk you through the technical bits and share the code behind it.
Kafka, Tinybird and a Data product
These are the main components for the application:
- A producer sends messages of “songs played” to a Kafka topic (around 5000 songs played per second)
- Tinybird constantly reads and ingests the data from that topic, materializing stats and making them immediately available to query via API endpoints.
- A data product (React app) consumes those API Endpoints and enables analysis of the data in real-time, filtering by artist, country, streaming platform, time period and more.

The data project
Tinybird’s Kafka connector enables ingestion of streaming data in real-time into Tinybird Data Sources. Through SQL pipes that calculate different stats, data gets materialized incrementally and enriched with song information into other data sources. Those are then used to expose the API endpoints.
This is a high level diagram of the data project.

Extraction
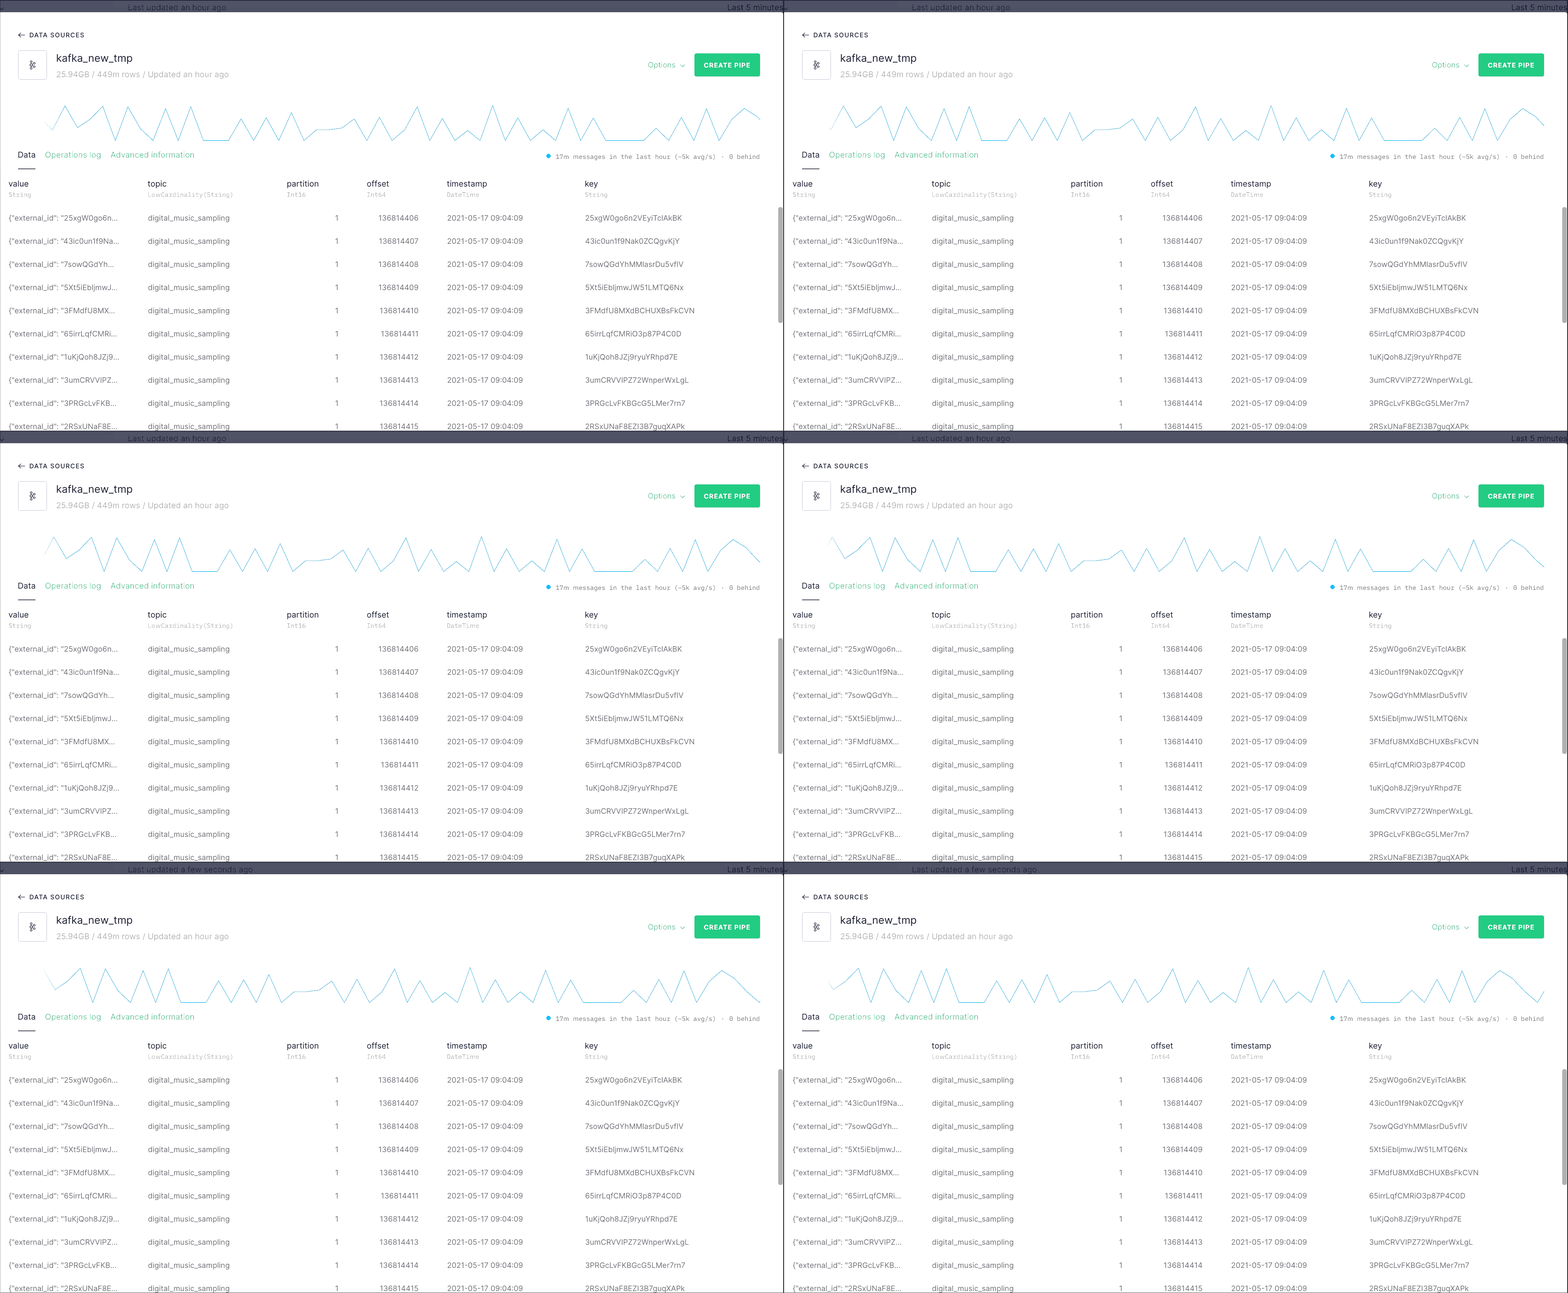
The songplays events are ingested to the Data Source called songplays_kafka_landing with our Kafka connector.

The ingested messages arrive as JSON objects with info about the song ID, time, country and streaming service for every song played. We extract each of those fields with the songplays_mv transformation pipe, which materializes the results to the songplays_kafka_destination Data Source.
With that we have converted JSON objects into structured data for us to query.
Enrichment
To have more info about the artist, album, song name… of each song, we need to join that with the songs_reference Data Source.
To make that join fast (on external_id, the song ID on Spotify), we are using a Data Source with a Join engine, a regular JOIN would work well in most cases. That Data Source is songs_reference_join_by_external_id
This is an example on how this enrichment takes place.
Aggregation
The songplays_aggregated Data Source is where we aggregate data by date, country, source, artist, song_title and album_name, for all the songs of the most popular artists.
We do that with the songplays_aggregated_mv pipe. This lets us go from having 10B rows to just 5M, making it possible to have fast queries pretty much indefinitely.
Publication through API Endpoints
Finally, we create some endpoints to calculate ranking by several fields and evolution across time of songs plays from each artist. These are the endpoint definitions:
Security
Tinybird lets you create tokens to secure the access to your endpoints, and one token can access more than one endpoint. A documentation page is generated automatically for each endpoint you create on Tinybird, and by visiting https://api.tinybird.co/endpoints?token={YOUR_TOKEN}, you can see the documentation for all the endpoints a token has access to.
For example, this would be that page for a token that has access to all the endpoints we created and used to create a website and visualize the data.
Visualizing the data
With the endpoints we defined previously, we created a website where artists can search for themselves and see a detailed view of how many times their music is being played, and how much money they are making, across different countries and platforms (remember, this data is not real, just a simulation based on some educated guesses).

If you’d like to explore the data project, as well as the code to create this web app, it’s all available in this GitHub repository.
About Galeo
We built this demo and live session in combination with our friends at Galeo. They provide professional services to companies by designing, constructing, and operating innovative data platforms that harness, integrate, and exploit dynamic data value.
If you need a partner to design or operate your data platform, there is no one better.
Do you want to build data products on top of your Kafka data?
With Tinybird you can analyze and develop production-ready data products over streaming data at any scale. Email us and we’ll get back to you right away!


