

Resend is a developer platform for sending transactional and marketing emails. If you don’t do much with email, well done, you’ve won in life. But if you do, Resend is probably going to save you a bunch of headaches.
Once you’re set up to send with Resend, how do you know you’re “doing email right”? Resend captures events about the status of your emails - when it's sent, delivered, bounced, etc. - and offers webhooks so you can push these events elsewhere. Sending these webhooks to Tinybird’s Events API works out of the box, so with a little bit of SQL you can finally know if “Dear Sir/Madam” is a better email intro than “Oi, you”.
The dev stack analytics template contains analytics dashboards for the most popular dev tools, and this week I’ll be working on the Resend dashboard, with a new video each day working through one chart at a time.
What events have we got?
Resend has a bunch of different events you can work with. There’s 3 objects you can get events for: emails, domains and contacts. I’ll start by focusing on emails. That gives you 7 different event types to look at:
- email.sent
- email.delivered
- email.delivery_delayed
- email.complained
- email.bounced
- email.opened
- email.clicked
The opened and clicked events depend on embedding a tracking pixel, which is not something I recommend if you want to stay out of Spam, so I’ll pretend they don’t exist.
Just sent, delivered and bounced should cover a vast majority of real world events and give you plenty to work with.
Getting events
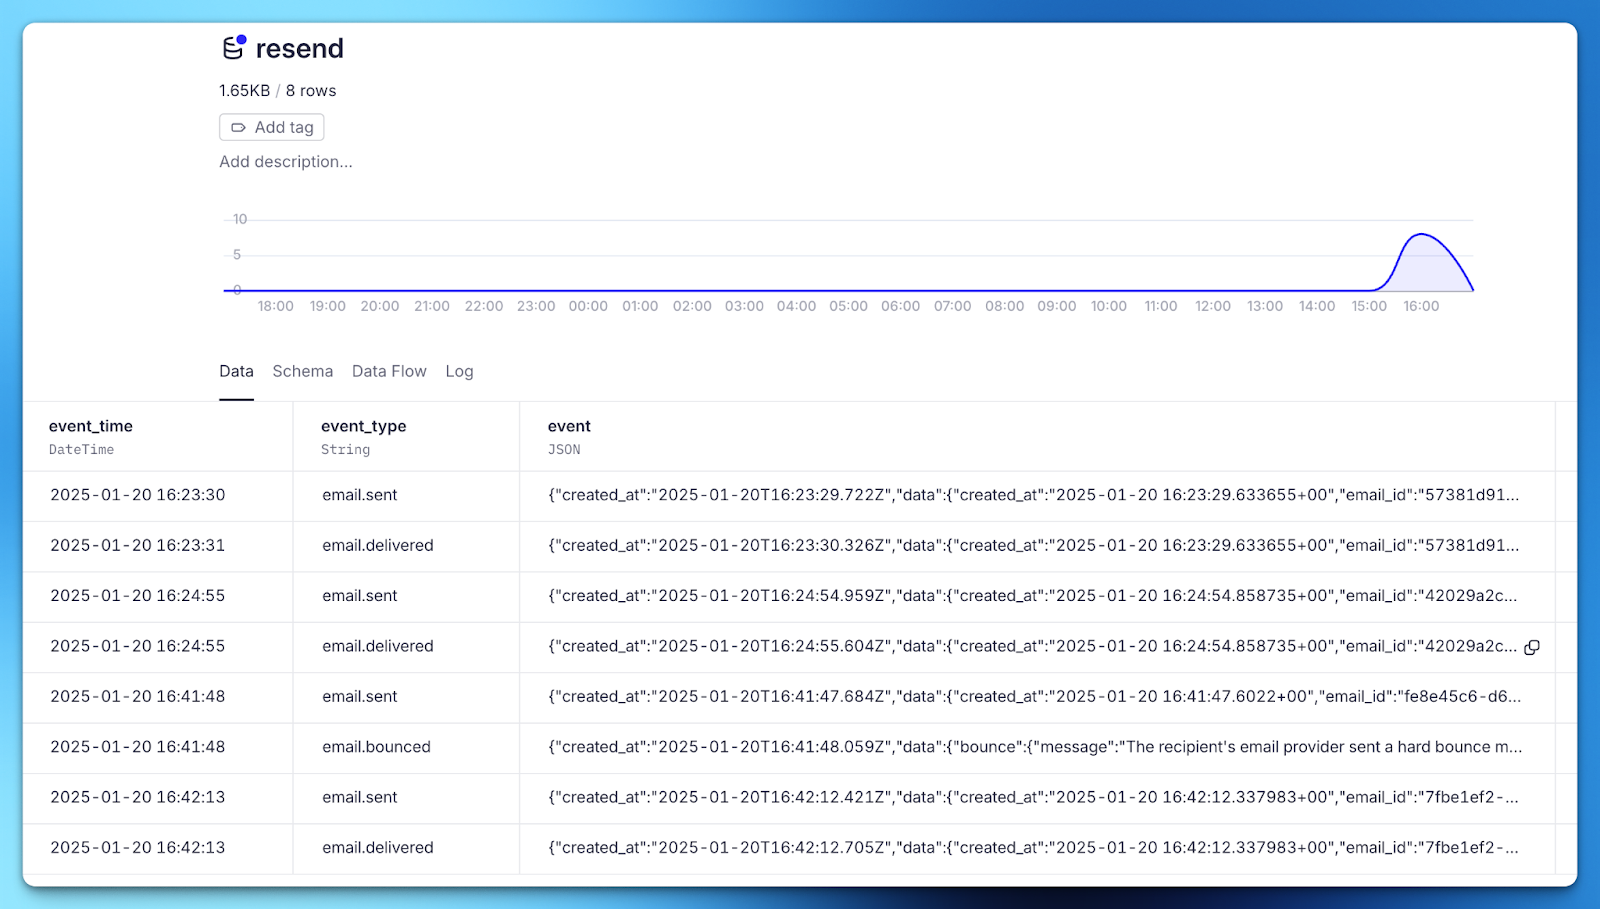
Configuring Resend webhooks to send to Tinybird only takes a minute or two and is covered in the docs. Once configured, you’ll have a Data Source receiving events that looks like this:
If you’re not yet sending production emails, or want to force specific events like bounces, you can send test emails.
Querying events
The Data Source of events is a time ordered append log. The event_type column will let you quickly filter for the specific events. With a Pipe, you can start to query your events in SQL.
A query like this will give you the email.sent events in time order:
Let’s say you want to plot your email sends over time. You don’t need the whole event, just a count that is aggregated by some time granularity that you can plot over time. You can use a query like this:
This will count how many emails are sent per day, giving you a result like:
That’s a super simple example, but from there you can start to build out anything you want to see.
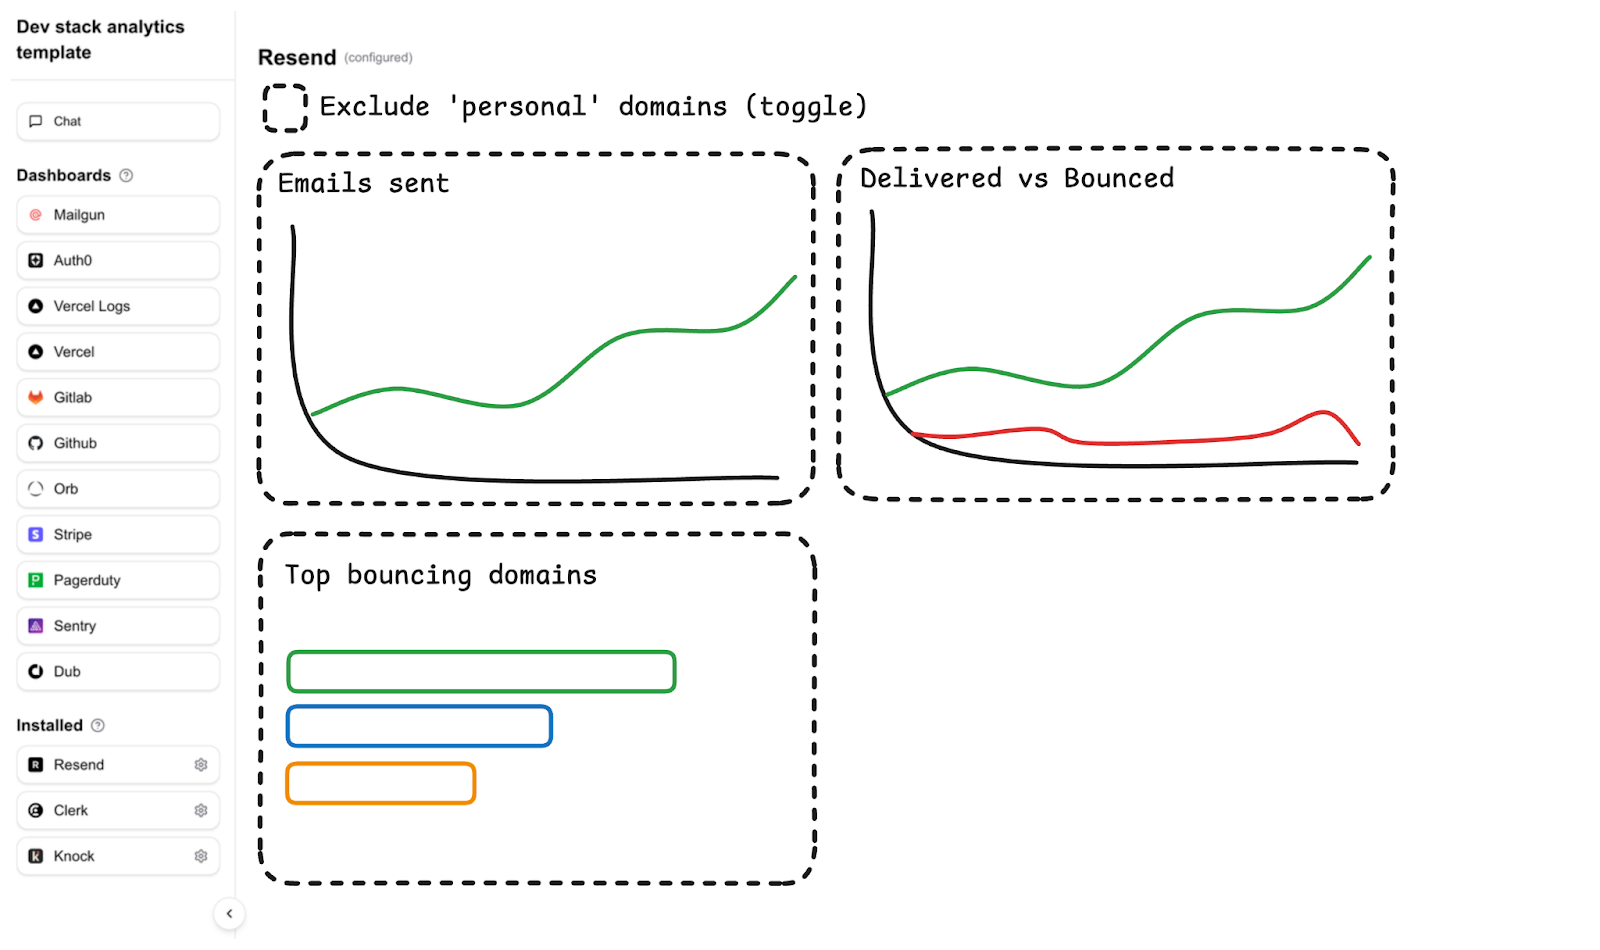
Building the dashboard
Over the next week, I’ll be working towards a dashboard that looks like the wireframe below, showing how each query and chart component is built. The code for the whole thing will be available in the dev stack analytics template.