


At Tinybird, we've spent years evolving our Kafka to ClickHouse® connector from a simple consumer script into a battle tested service that processes billions of events daily. This post covers why we built our own connector instead of using ClickHouse's built-in Kafka engine, the architecture decisions that make it scale and the production challenges we've solved along the way.
Why build our own Kafka connector?
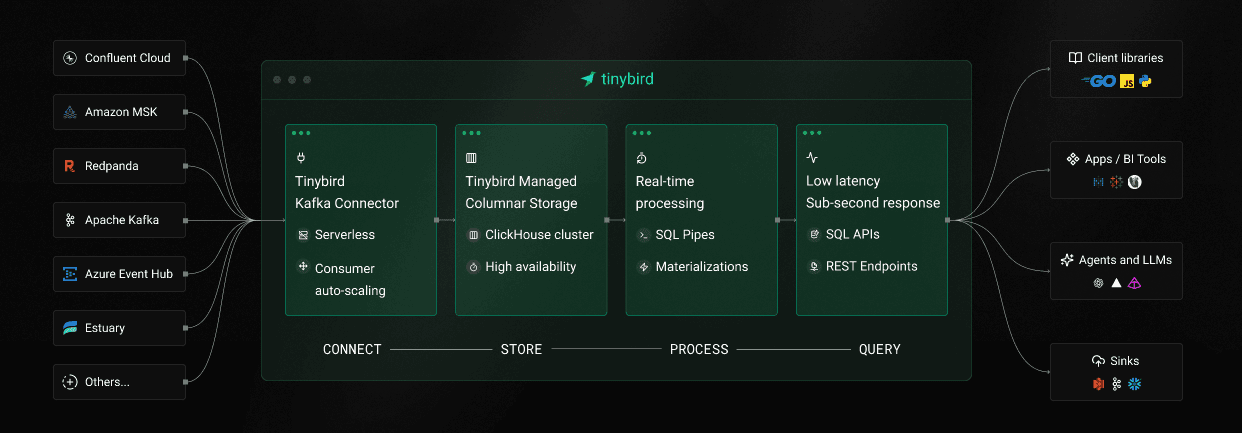
Tinybird is a managed ClickHouse with a focus on the best developer experience. Our users expect analytics over Kafka to just work: connect, point to a topic and start querying. Building our own connector lets us deliver that experience.
ClickHouse's built-in Kafka engine has limitations: partial Schema Registry support (Avro only), manual offset management and scaling challenges. The Kafka ecosystem adds complexity too, with Confluent, Redpanda, MSK, Event Hubs and others each having protocol quirks that break assumptions from vanilla Apache Kafka.
Even with our own ClickHouse fork, coupling the connector to the database creates operational headaches. Cluster upgrades are intricate and tying connector fixes to database releases slows iteration. A separate service lets us move fast on Kafka support while keeping ClickHouse upgrades independent.
Using an independent service to load data also brings additional benefits:
- Offloads work from ClickHouse: Parsing Avro, converting to RowBinary and handling inserts happen in the connector service, reducing load on the database cluster
- Simpler private link configuration: Only the connector service needs to be added to a private link, rather than the entire ClickHouse cluster
Architecture of a scalable Kafka connector
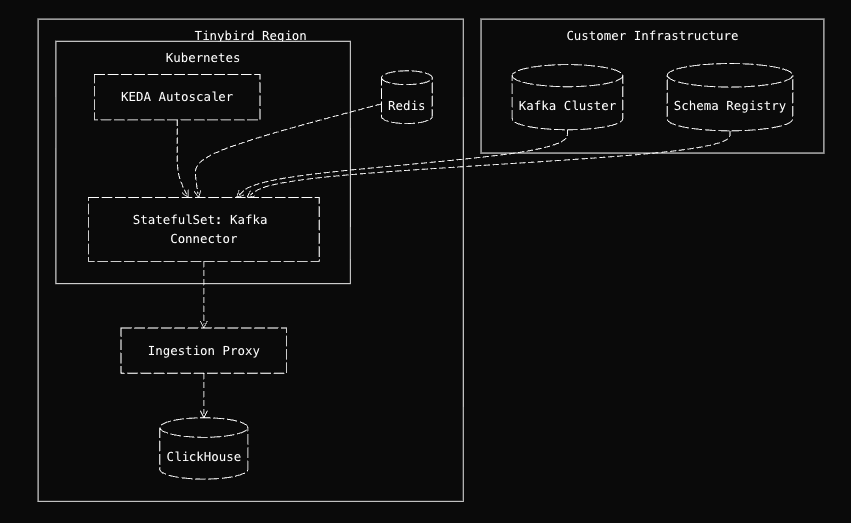
The Tinybird Kafka connector is a Python service deployed as Kubernetes StatefulSets across multiple regions. It consumes from Kafka topics, transforms messages and inserts them into ClickHouse.
Wait, Python for a high throughput Kafka connector? Yes, and for good reasons:
- I/O bound vs CPU bound: The bottleneck isn't Python's interpreter, it's network I/O and ClickHouse's ingestion capacity
- Native performance where it matters: Performance-critical components use native libraries that release the GIL during I/O operations:
confluent_kafka(C++ bindings via librdkafka) for Kafka interactionsorjson(Rust) for JSON parsing, 2-3x faster than Python's standard libraryfastavrofor Avro deserialization- Tinybird's in-house C++ library for optimized RowBinary encoding (30% less overhead when inserting to ClickHouse)
pycurl(C) for HTTP requests
- Developer expertise: Those are good technical reasons but our engineering team's experience matters too. Other services in our backend are already written in Python, which allows for rapid iteration on customer needs and reusing existing ClickHouse tooling.
The data flows through the system in a clear pipeline:
Kafka Topics
  → Kafka Consumer
    → Schema Deserialization
      → RowBinary Encoding
        → Ingestion proxy
          → ClickHouse tables
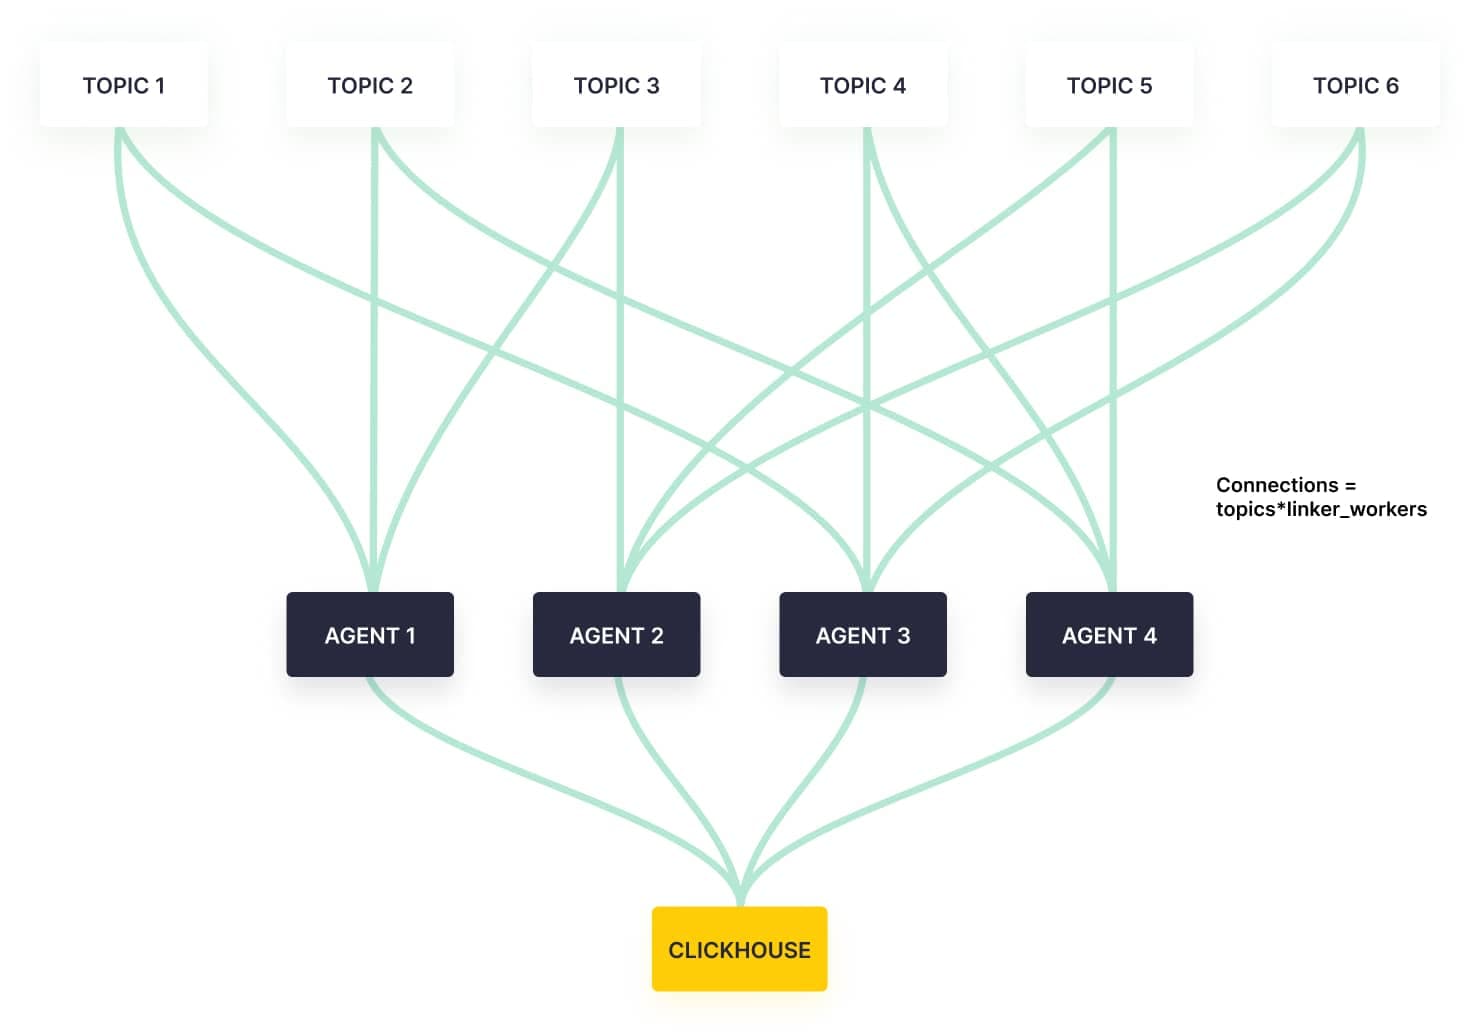
Controller/Worker Pattern
One of our key architectural decisions was implementing a controller/worker pattern. Instead of a monolithic consumer, we use a controller that manages multiple independent workers. One Kafka topic or datasource can be handled by one or more workers, which is how we achieve horizontal scaling.
This design brings several benefits:
- Fault isolation: One customer's Kafka issues don't impact others
- Resource efficiency: New datasources start consuming without requiring extra resources. We only scale when workers are using all their CPU, reducing the cost per datasource
- Independent scalability: Allocate resources per customer workload at topic level
The controller listens to Redis pub/sub channels for configuration updates, enabling zero downtime changes. When you create a new Kafka datasource in Tinybird, the backend publishes a configuration update and the controller automatically spins up a new worker to consume that topic.
Five design decisions that make it production ready
Several design decisions differentiate a production ready connector from a simple Kafka consumer script:
1. Rendezvous Hashing for Topic Assignment
We use rendezvous hashing to assign topics to workers:
- Each worker calculates a hash based score for each topic
- Topics are assigned to the worker with the highest score. When a topic requires N workers, we select the N workers with the highest scores
- Kafka's native assignment strategy distributes partitions among the workers handling the same topic (we set
group.instance.idusing the pod name to ensure stable assignments)
Combined with stable pod names from StatefulSets, rendezvous hashing minimizes consumer group rebalances during pod restarts. Note that this approach helps with restarts but not with scaling up or down, which would require a different strategy like consistent hashing.
2. Circuit Breaker Pattern for Reliability
To prevent cascading failures, we implemented the circuit breaker pattern:
- Monitors error rates and failure patterns
- Opens the circuit when error thresholds are exceeded
- Stops consuming when the circuit is open
- Automatically retries with backoff periods
We classify errors into four types to enable intelligent handling:
- FATAL: Requires worker restart (configuration errors)
- RECOVERABLE: Transient errors (network timeouts, broker unavailable)
- USER: User configuration errors (authentication, authorization). Users are notified via email to fix these issues
- INTERNAL: Internal processing errors
Only recoverable errors trigger the circuit breaker, preventing unnecessary service disruption from user errors or fatal conditions.
3. RowBinary Encoding and Ingestion Proxy
Messages are encoded into RowBinary format, a compact binary format optimized for ClickHouse. Smaller payload sizes, faster serialization and native type support deliver significant performance benefits over JSON. Our in house C++ library handles type conversion, null handling and binary serialization at native speed, making ingestion 30% faster.
RowBinary data is sent to our ingestion proxy (internally called "gatherer") rather than directly to ClickHouse. This is critical because ClickHouse isn't designed for high frequency streaming inserts. Without buffering, you quickly hit TOO_MANY_PARTS errors as each insert creates a new part. The gatherer buffers and batches inserts, preventing parts explosion while maintaining low latency.
4. Flexible Flush Strategies
We support three configurable flush triggers (first condition met triggers flush):
- Time based: Flush after time interval
- Record based: Flush after N records
- Byte based: Flush after N bytes
This allows fine tuning for low latency or high throughput scenarios
5. Enterprise Ready Features
Beyond the core architecture, we've built features that enterprise customers expect:
- Schema Registry integration: Full Confluent Schema Registry support with Avro and JSON Schema formats, backward/forward compatible schema evolution and native logical types (UUID, Datetime, Timestamp)
- Automatic metadata injection: Every message includes Kafka metadata columns (
__topic,__partition,__offset,__timestamp,__key,__headers) for routing, debugging and auditing - Kafka headers support: Binary and JSON header formats stored as
Map(String,String)in ClickHouse, available in SQL queries for routing and tracing. See Using custom Kafka headers for examples - Quarantine table: Failed messages (invalid schemas, oversized, encoding errors) are written to a
_quarantinetable with error details for later analysis - Zero downtime configuration: Dynamic updates via Redis pub/sub let you create, update or remove datasources without service restarts
How we scale and monitor billions of events
Running a production connector at scale requires intelligent scaling and comprehensive observability.
Kubernetes Native Deployment with KEDA Autoscaling
Our connector deploys as a Kubernetes StatefulSet (not Deployment) for stable pod names and ordered rollouts. Combined with rendezvous hashing, stable pod names reduce consumer group rebalances during restarts (for example, when rolling out a new version). We operate across multiple cloud and provider regions.
For autoscaling, we leverage KEDA (Kubernetes Event driven Autoscaling) with multiple trigger types:
- CPU based: Traditional CPU utilization scaling
- Latency based: Uses consumer latency histogram from Prometheus
Latency based scaling is easier to understand than lag based: it's intuitive that we want to scale when latency exceeds 60 seconds, whereas a lag of 10,000 messages is harder to interpret without context.
Multi Layered Observability
Debugging production issues requires comprehensive observability. Our connector provides three parallel metric streams, all generated from the same source data:
1. User Facing Operations Log (ClickHouse)
Every Tinybird region has an internal ClickHouse cluster where we ingest instrumentation from all our services. The Kafka connector logs every operation to tinybird.kafka_ops_log, a Service Data Source we expose to users so they can monitor their own Kafka ingestion. This is the same pattern we use for API request metrics, ingestion metrics, storage metrics and more, as described in How we built Tinybird Wrapped.
Users can query this log to monitor connector health, identify bottlenecks and track performance. For example, to check consumer lag per partition:
-- consumer lag trend over time
SELECT
    toStartOfHour(timestamp) as hour,
    datasource_id,
    topic,
    partition,
    max(lag) as max_lag,
    avg(lag) as avg_lag
FROM tinybird.kafka_ops_log
WHERE timestamp > now() - INTERVAL 24 hour
  AND partition >= 0
  AND msg_type = 'info'
GROUP BY hour, datasource_id, topic, partition
ORDER BY hour DESC, max_lag DESC
For comprehensive monitoring queries including throughput tracking, error monitoring and alerting setup, see the Kafka monitoring guide.
2. Prometheus Metrics via Tinybird API
Prometheus metrics are extracted from the same kafka_ops_log in our Tinybird instance. We expose a Tinybird API endpoint in Prometheus format that Grafana polls for monitoring dashboards. Internally, we use this Prometheus endpoint for our latency based auto-scaler. This gives us real time metrics without running a separate Prometheus server, just SQL over ClickHouse formatted as Prometheus. Users can also consume this data to build their own monitoring dashboards.
Getting Started
Getting started with the Tinybird Kafka connector is straightforward:
Create connection
tb connection create kafka
Create Datasource
tb datasource create --kafka
Create an API
# first_kafka_api.pipe
TOKEN "kafka_read" READ

NODE first_kafka_api_node
SQL >
   SELECT
       toStartOfMinute(__timestamp) AS minute,
       count() AS events
   FROM kafka_events
   GROUP BY minute
   ORDER BY minute DESC

TYPE endpoint
Deploy and use
tb --cloud deploy
curl https://api.tinybird.co/v0/pipes/first_kafka_api.json?token=...
That's it! You now have a real-time API consuming from Kafka. For a complete end to end tutorial building a real-time e commerce analytics API from Kafka, including enrichment, materialized views and advanced endpoints, see Build a Real-Time Ecommerce Analytics API from Kafka in 15 Minutes.
What we learned
Building a production Kafka connector requires solving hard problems: distributed coordination, scaling, reliability, observability and operational simplicity. Our approach focused on:
- Controller/worker architecture for isolation and scalability
- Rendezvous hashing for intelligent topic assignment
- Circuit breaker pattern for fault tolerance
- Zero downtime updates for operational simplicity
- Comprehensive observability for debugging and monitoring
These design decisions allow the connector to handle billions of events daily while maintaining low latency and high reliability.
What started as a simple script has evolved into a robust, production grade connector that powers real-time analytics for enterprises across industries. The journey taught us valuable lessons about balancing competing concerns: throughput vs latency, operational simplicity vs configurability and language performance vs developer productivity.
Sometimes the "slower" language (Python) is the right choice when it's not the bottleneck and when it brings other advantages like rapid iteration and excellent ecosystem support. By focusing on the true bottlenecks (network I/O and ClickHouse ingestion) and using native libraries for performance critical components, we built a high performance connector without sacrificing developer productivity.
Whether you're processing millions or billions of events, the same principles apply: understand your bottlenecks, design for operability and instrument everything. With the right architecture, even complex systems can appear simple to operate.
Want to try it yourself? Get started with the Kafka connector at tinybird.co.